
Generating spectrograms with arecord, sox and ffmpeg/avconv
Create a spectrogram (Image)
The following command records a WAV file using ALSA (Device 2.0). Sox is piped into the process here — which is optional — but can be used to apply filters such as noise reduction or normalization to the resulting file:
arecord -D hw:2,0 -r 32000 -f S16_LE -c 1 -t wav | sox -t wav -c 1 -L -b 16 -r 32000 - test.wav
Once you have the WAV file, generate a spectrogram image with sox:
sox test.wav -n spectrogram -o image.png
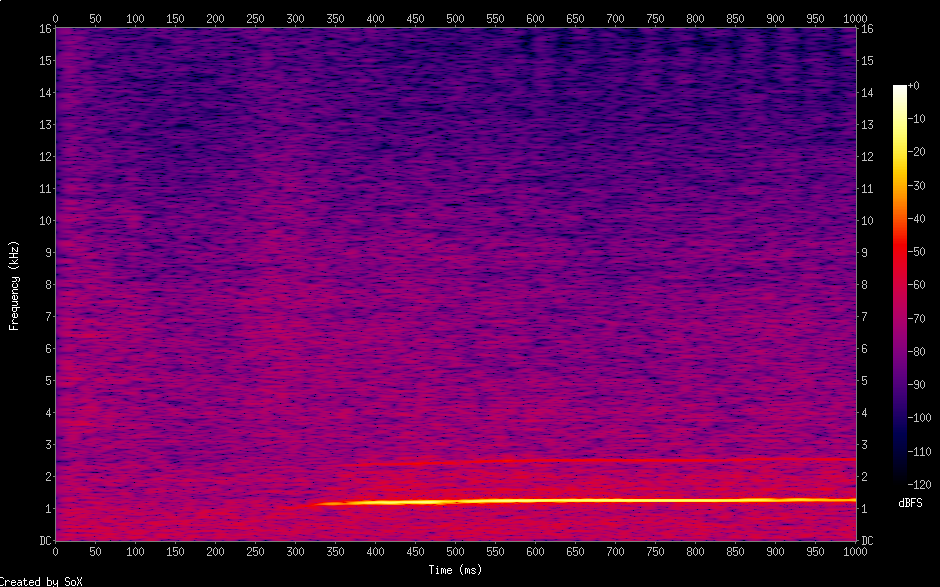
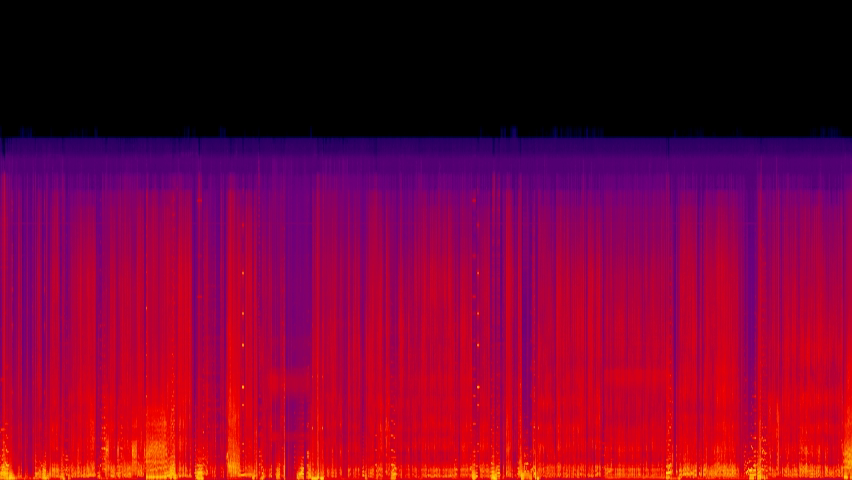
A spectrogram image can also be created directly from a video file using ffmpeg:
ffmpeg -i test.avi -lavfi showspectrumpic=s=hd480:legend=0,format=yuv420p out.png
For older systems using avconv instead of ffmpeg:
avconv -i test.avi -lavfi showspectrumpic=s=hd480:legend=0,format=yuv420p out.png
Create a spectrogram (Video)
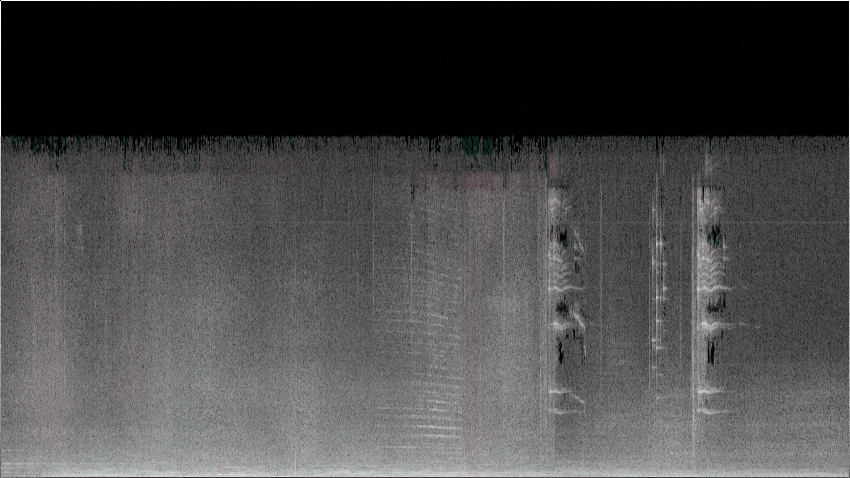
To generate a scrolling spectrogram video from a video file, use ffmpeg's showspectrum filter:
ffmpeg -i test.avi -lavfi showspectrum=s=1280x480:slide=1,format=yuv420p -c:v libx264 out.avi
This renders the audio spectrum as a moving video, saved as out.avi.
Alternatives with mplayer and sox
You can also generate a spectrogram from a video using mplayer to extract the audio first:
mplayer test.mp4 -ao pcm:file=/dev/stdout -vo null > test.wav
Then generate the spectrogram from the extracted WAV file:
sox test.wav -n spectrogram -o test.png
Comparing Spectrograms
Spectrograms created this way can be directly compared. However, even with seemingly identical WAV files, this comparison can be tricky.
To make differences more visible, creating a spectrogram diff is recommended.
First, create a diff WAV file by mixing the two sources with inverted polarity:
sox -m -v 1 source1.wav -v -1 source2.wav diff.wav
Then generate the spectrogram of the difference:
sox diff.wav -n spectrogram -o diff.png
If the two files are identical, the result will be silence and the spectrogram will be nearly empty. Any audible differences show up as frequency content in the diff.